Selected Projects
Neighborhood Similarity Metric
Data Pipelining, Machine Learning, Technical Framework
This app is a framework built of multiple parts that can be altered to fit varying business needs. It uses a similarity metric to find neighborhoods similar to ones the startup have previously successully invested in. The project involved developing a framework of data pipelining, modeling, and user-based flexibility that can be built upon and easily scaled for use in future markets!
Data Reporting System
Cloud-based Data System
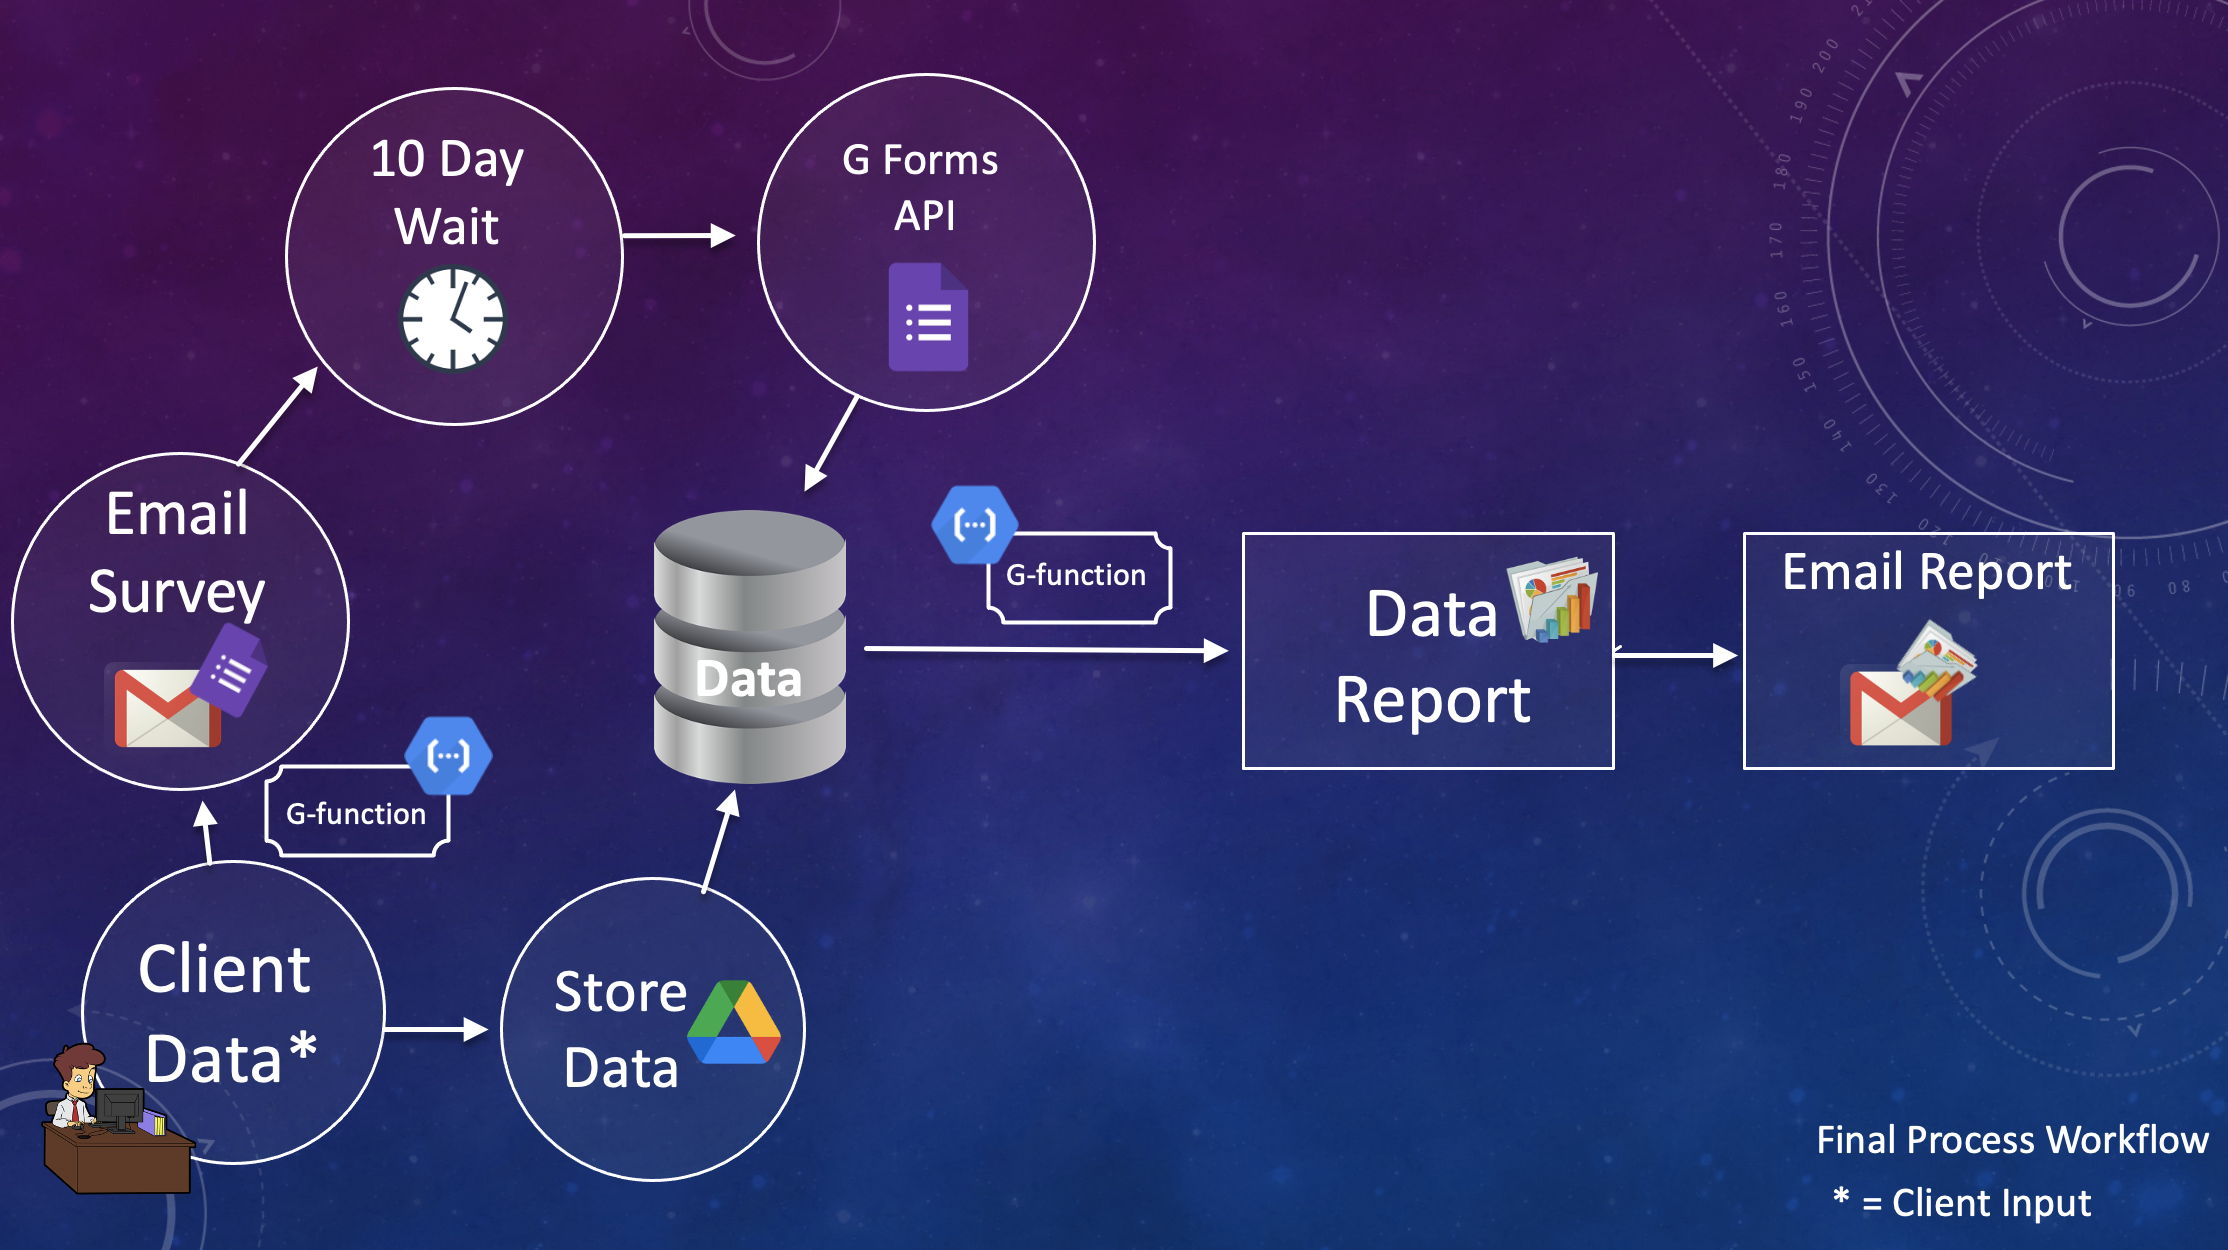
This is a project I am working on as part of my fellowship with Credit Counseling Services of Savannah, a nonprofit credit counseling organization. I was granted a Cohen Summer Public Service fellowship to conduct a data report for the nonprofit. Along the way, I wanted to automate my work so that they'd be able to run the same reports and analyses I was running, but on their own time, with just the click of a button! This project is being built upon currently and will eventually include reporting capabilities on all their services. I am using google cloud functions to trigger emails to clients, running python to pull a report given the client data and the survey data. The system is built with React, Node.js, FireBase, Python, and google cloud.
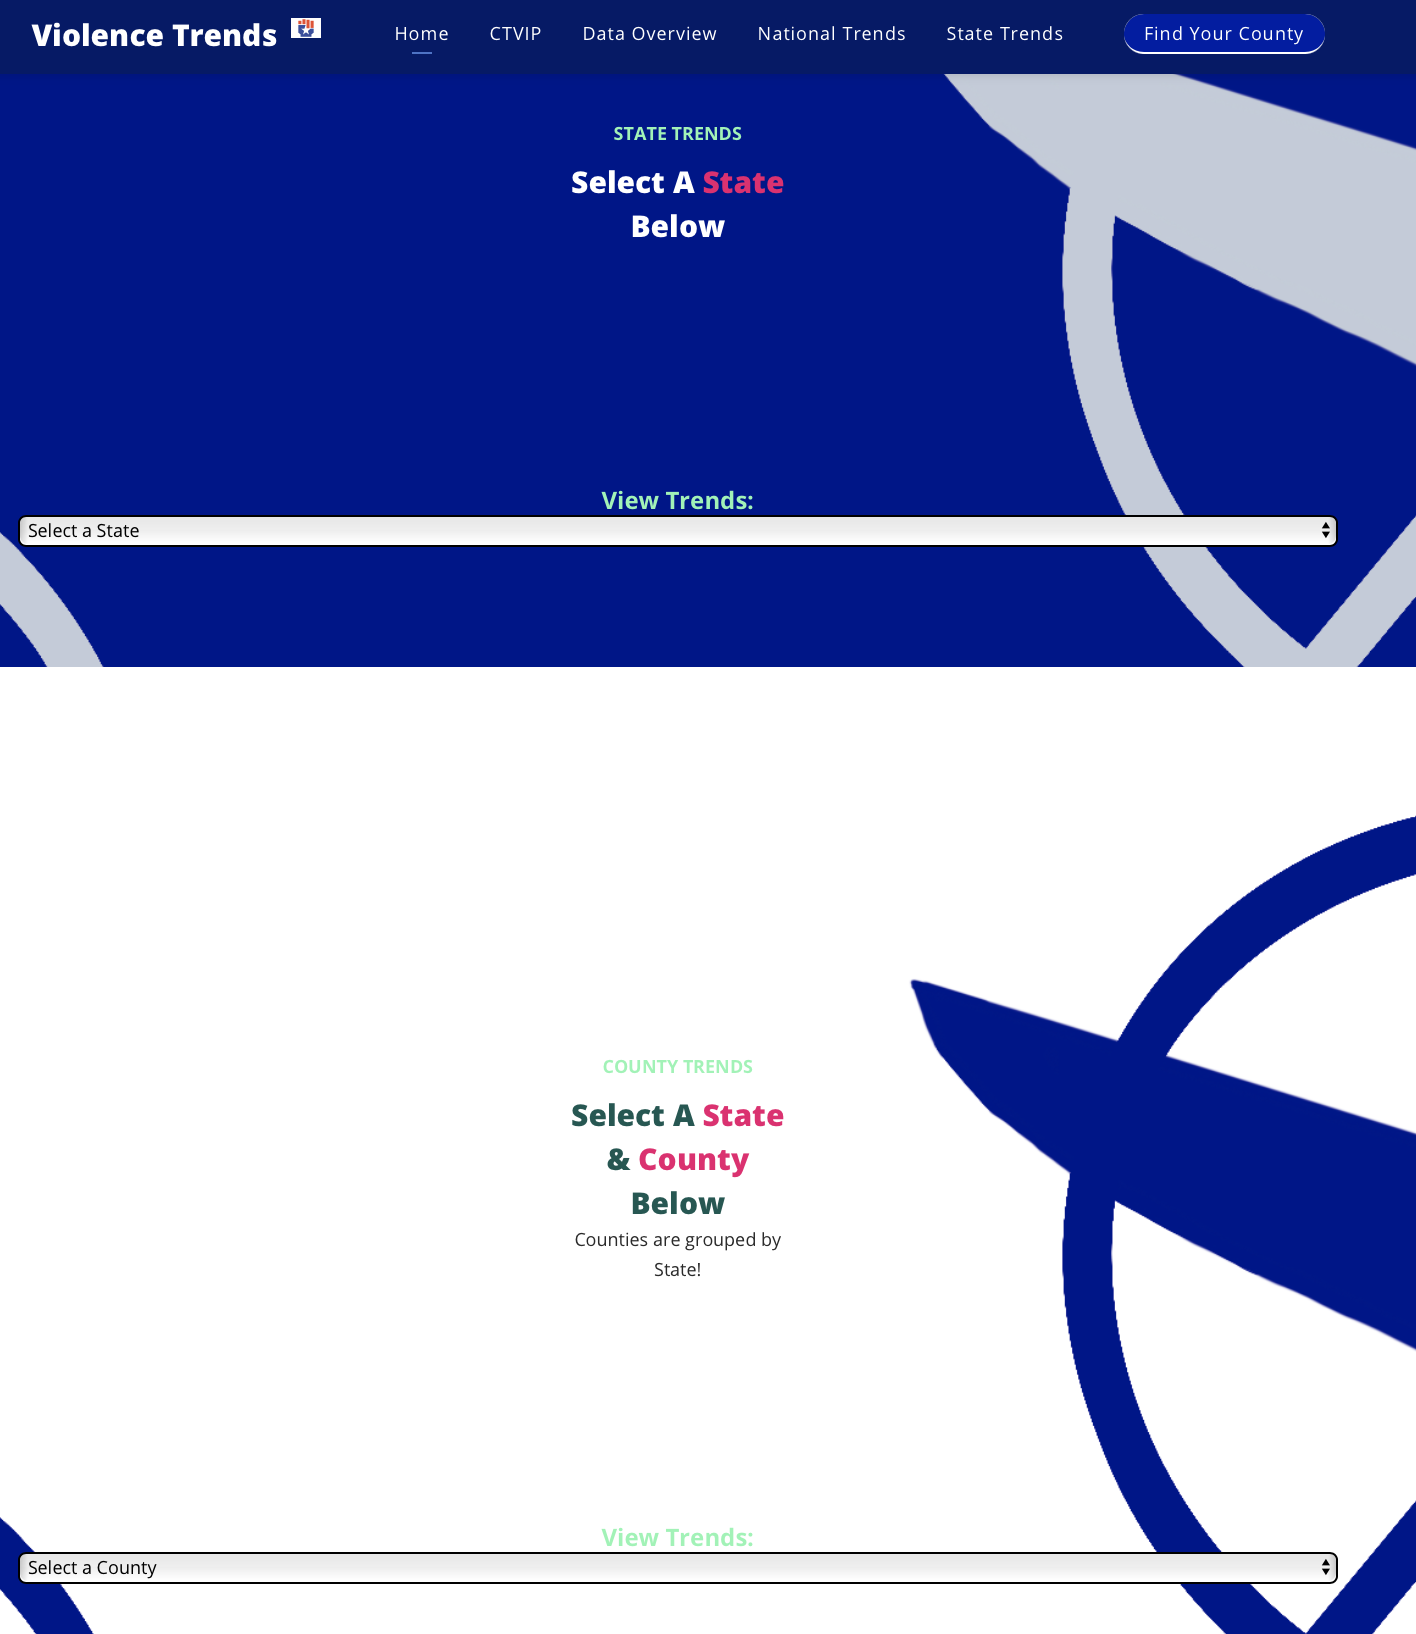
National Violence Trends
This web-based data interactive visualization displays national violence levels indicated by homicide rates. It was my final project for my fellowship with Data 2 the People, related to our work with a local violence prevention organization. Made with HTML,CSS,JS (D3, jquery).
Plant Classification App
Deep Learning
This app uses the power of neural networks built on VGG16 convolutional networks to classify specific plant leaves by plant type. It was one of the projects I worked on during my time at machine learning bootcamp!
Universal Healthcare Discussions
Natural Language Processing
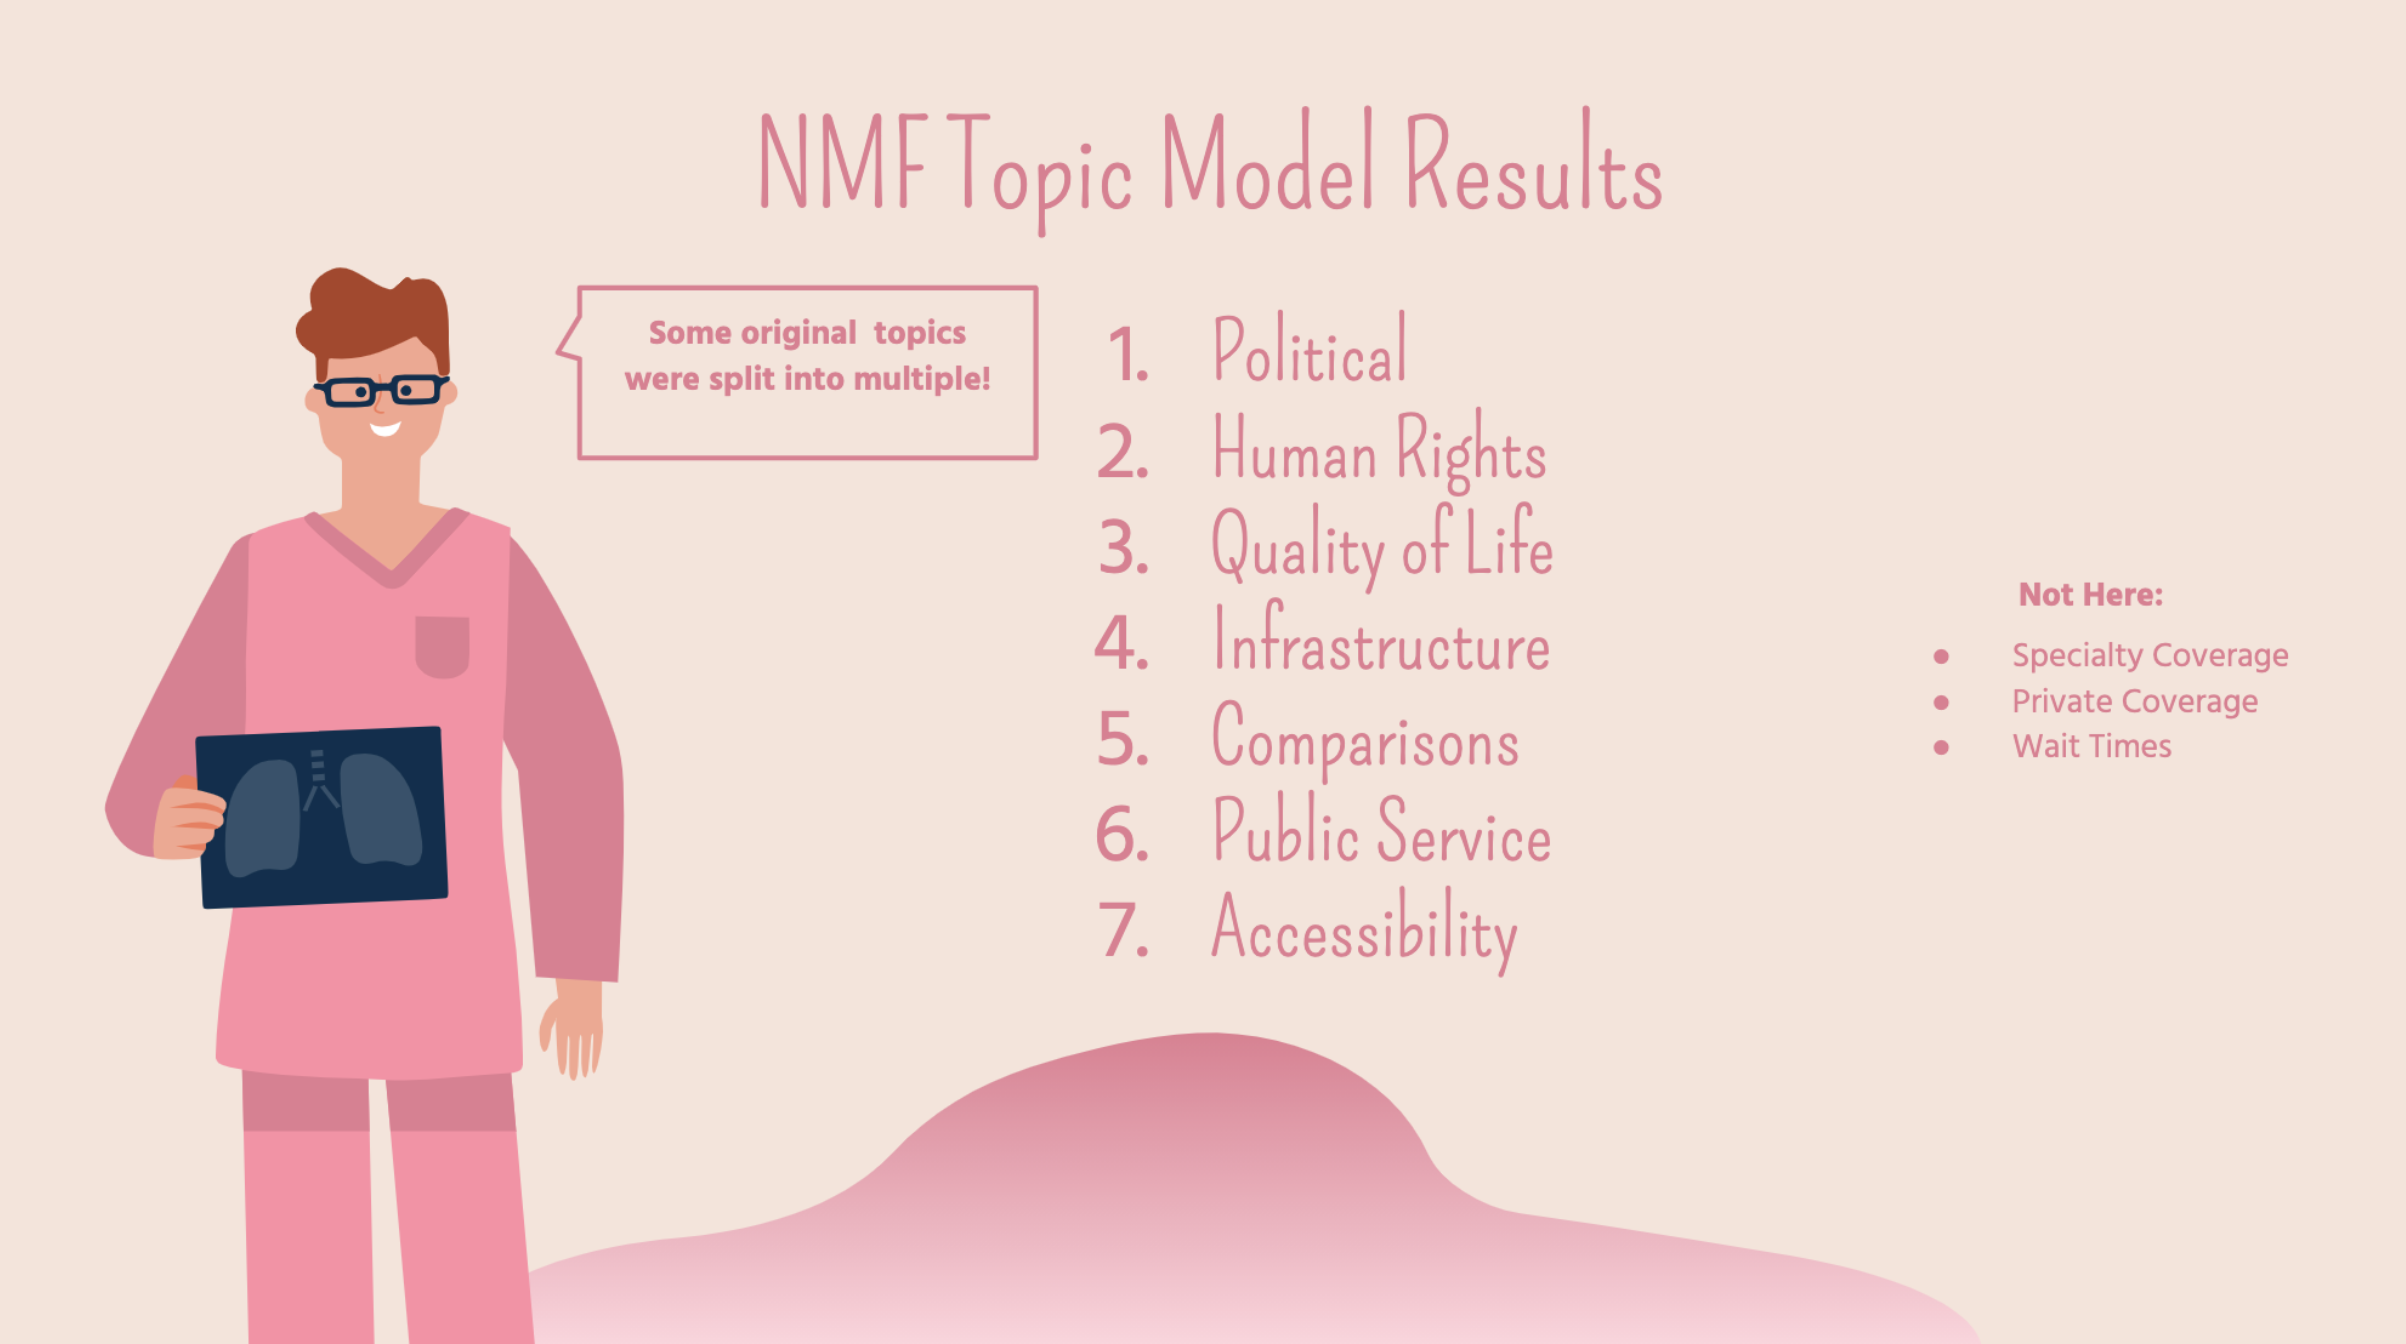
The goal of this project was to use natural language processing techniques to craft a topic model, delineating subtopics of discussion surrounding universal healthcare on twitter. I identified a list of 7 subtopics that are the main categories of conversation surrounding universal healthcare. I also performed sentiment analysis on each of the topics from the topic model to analyse what subtopics might be more contentious and should be approached with more caution/analysis/thoughtfulness.
Flight Delay Prediction Model
Classification
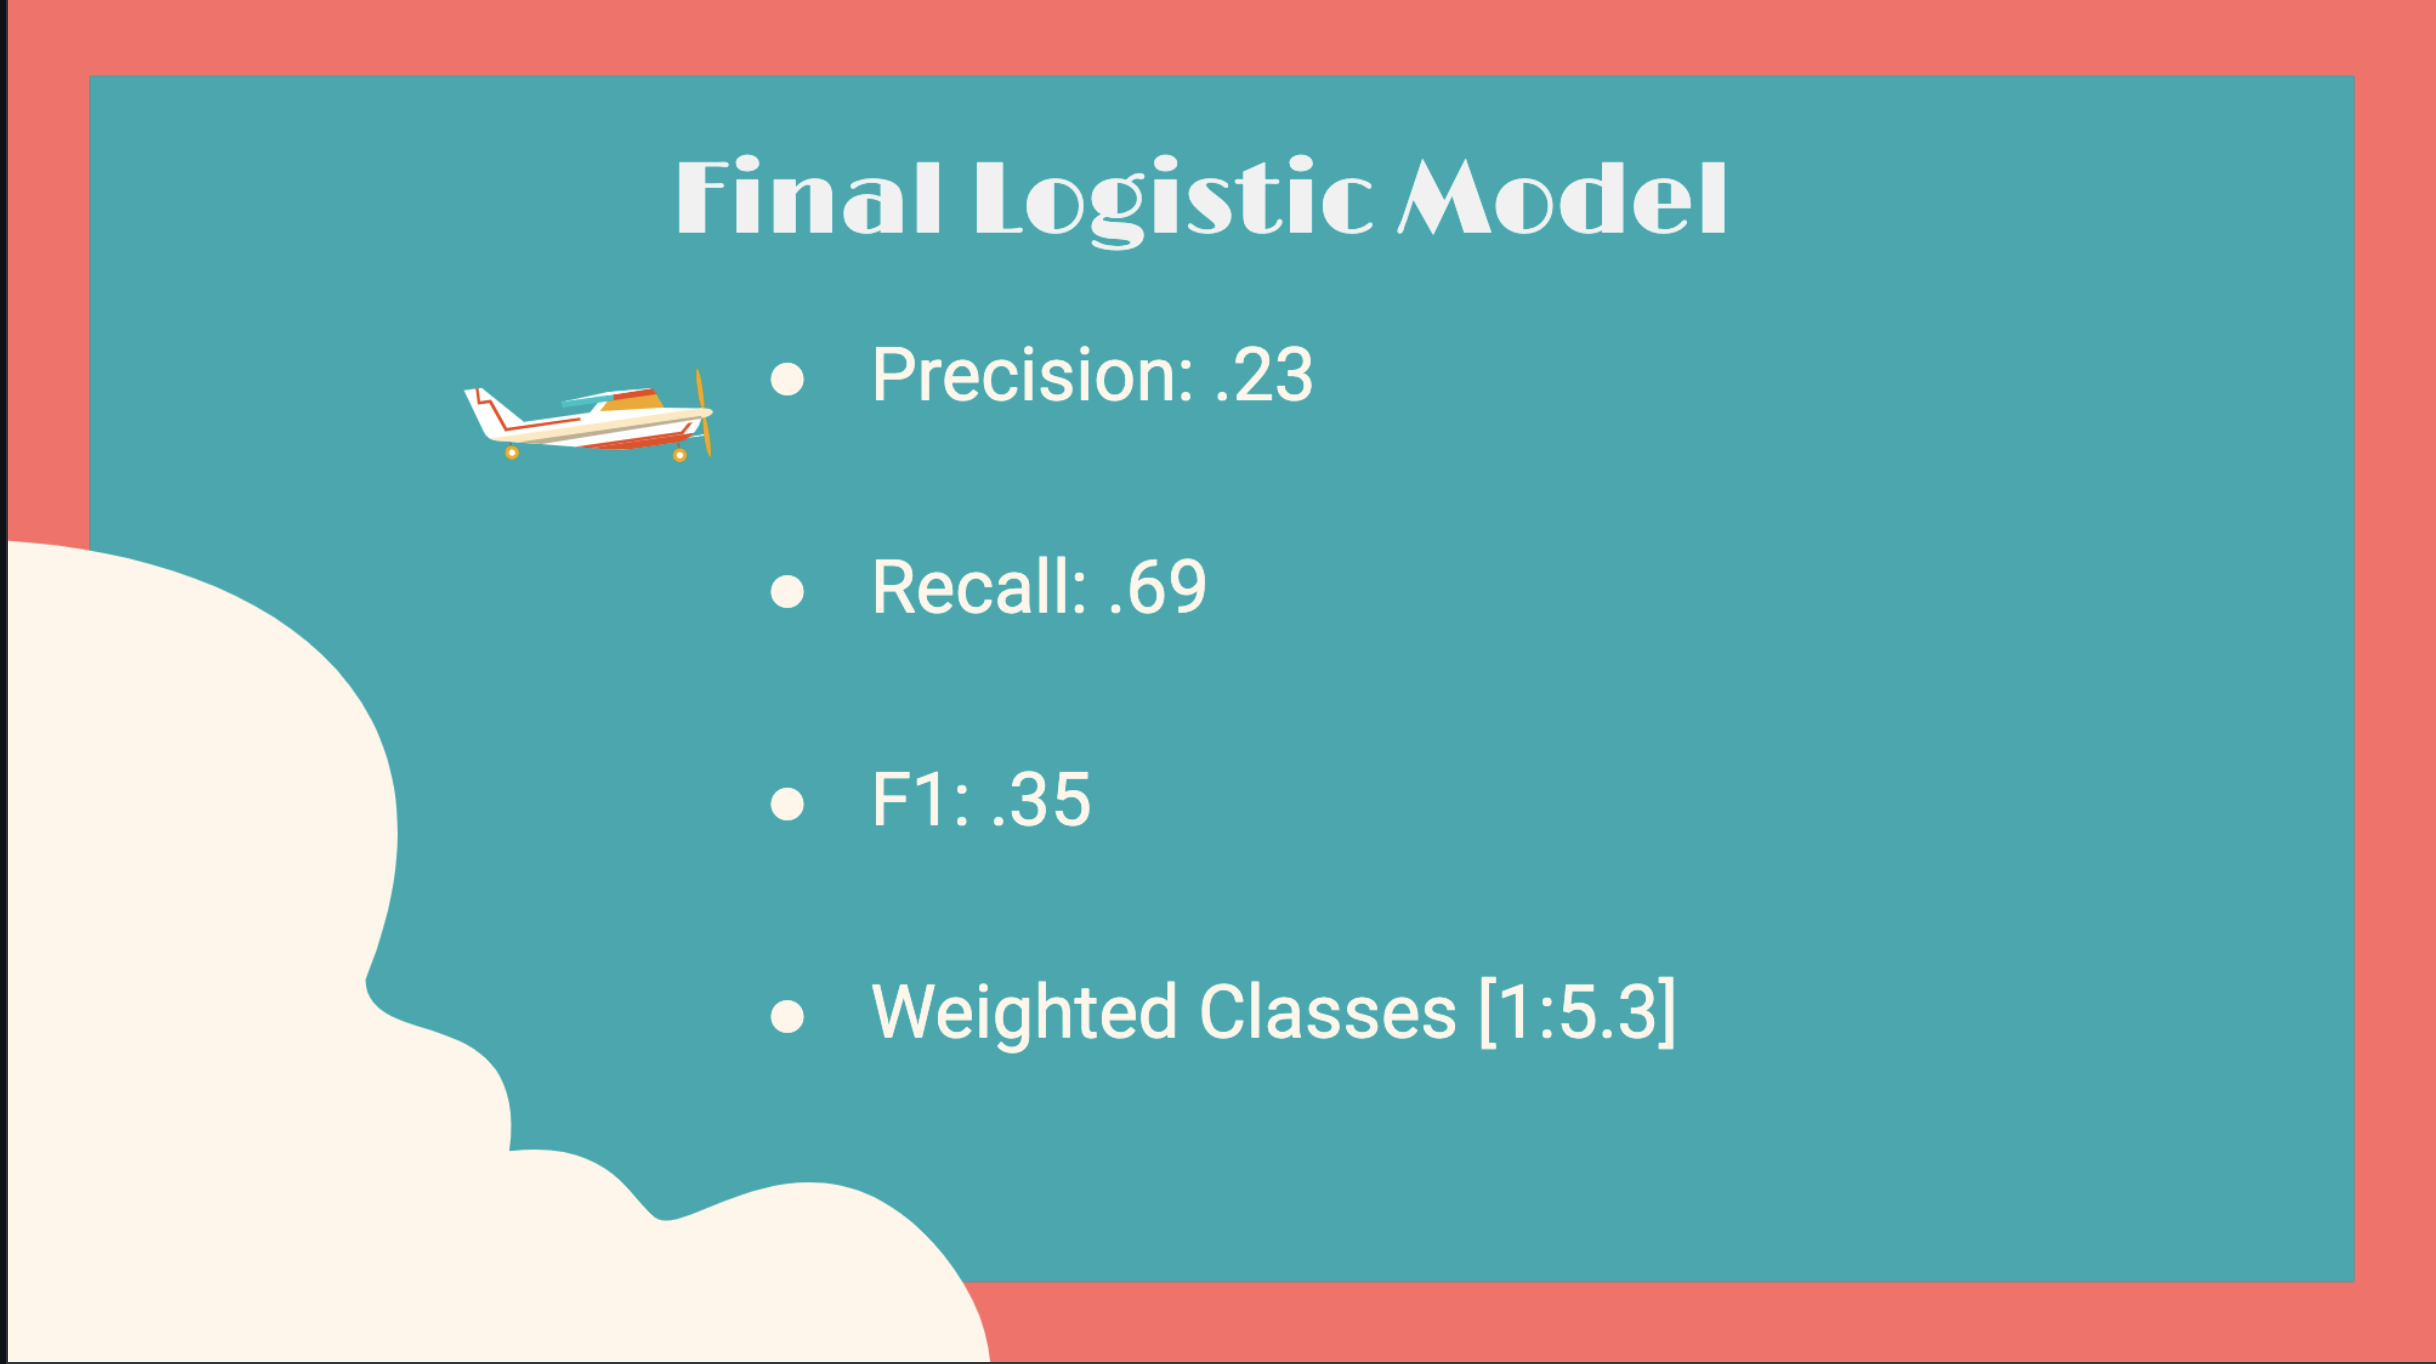
Created classification models to predict whether a domestic flight would be 25+ minutes late to arrival. After creating three types of models: KNN, Logistic, and randomforest, I finalized the logistic model and optimized its f1 score for a balanced precision and recall rate. This was another project I made and presented during my time at machine learning bootcamp! It was a great project for me to practice testing and comparing models, using APIs, critiquing my own models and thinking about how to improve future work!
Stargazing Night Data Pipeline
Data Engineering
This app provides the user with the best upcoming days to stargaze and also provides location suggestions according to light pollution, and general public spaces data from google. It is under construction for improvement!
MTA Reduced Risk Travel Guide
Data Processing & Visualization
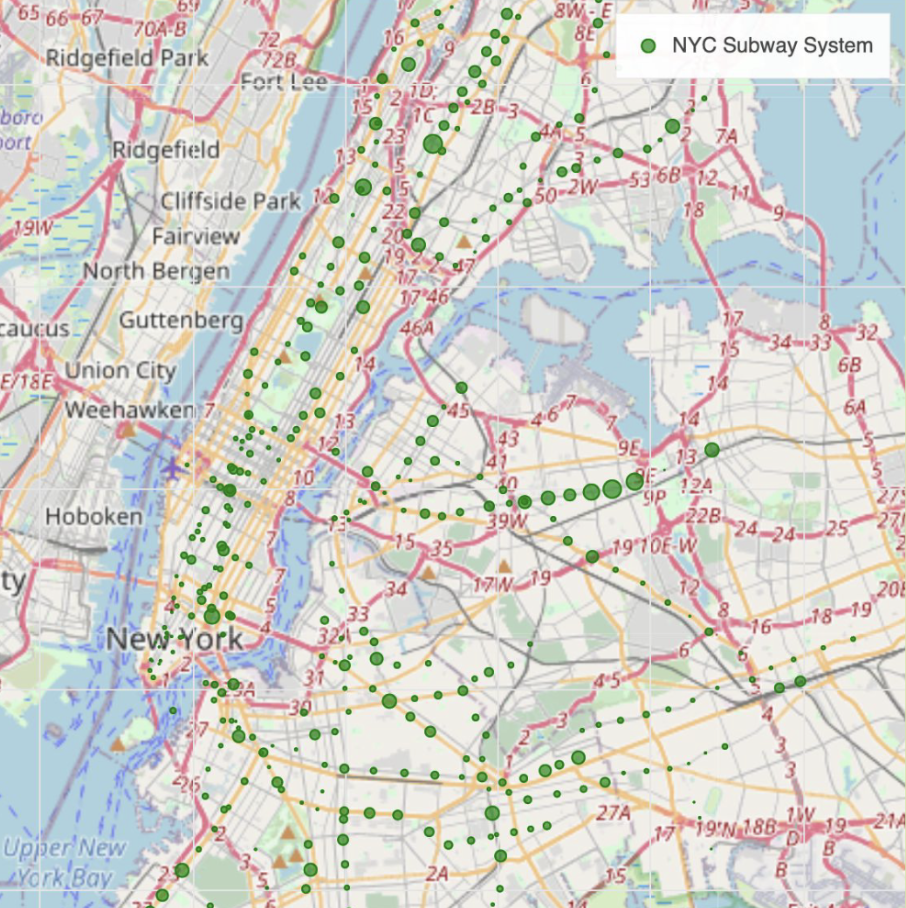
The goal of this project was to use visualizations to depict best times and stations for low risk travel during the COVID-19 Pandemic for at-risk populations in New York City. I worked with turnstile data directly provided by the MTA, along with two other data sets that provided ADA accessibility information, as well as geolocational information. Leveraging these three data sets helped me build an interactive map within the code jupyter notebook that allows you to compare average traffic levels between stations on various days of the week. This graphic is supplemented and generally aided by heatmap visualizations, which provide a more in-depth look at traffic levels during certain times of the day and week. These results could greatly aid immunocompromised and older travelers in deciding when to plan certain trips around the city.
Billboard 200 Prediction Model
Regression & Web-Scraping
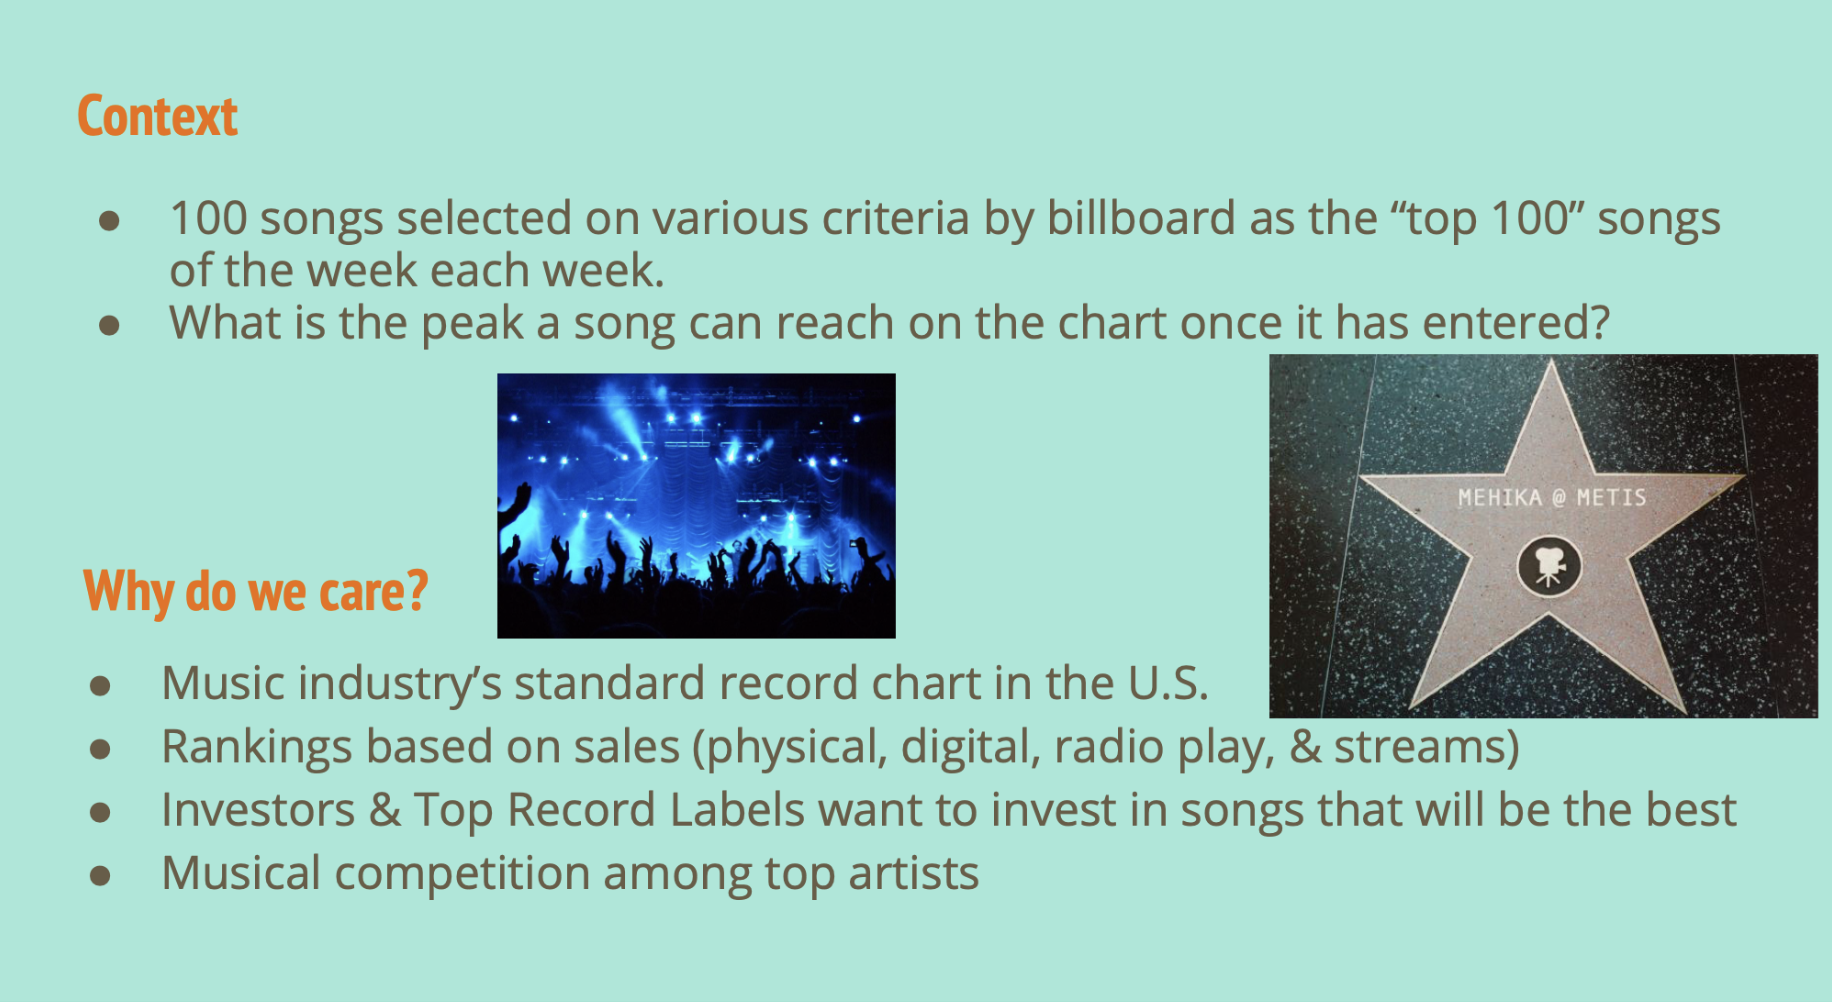
This project used billboard data combined with data from the most popular subscription music streaming service to predict the peak ranking a song would reach on billboard given a select number of features. After building and comparing multiple models, there are a select few features from the original datasets that provide a decent prediction about the peak a song may reach in a given week.
Restaurant Business Data Dashboarding
Business Data
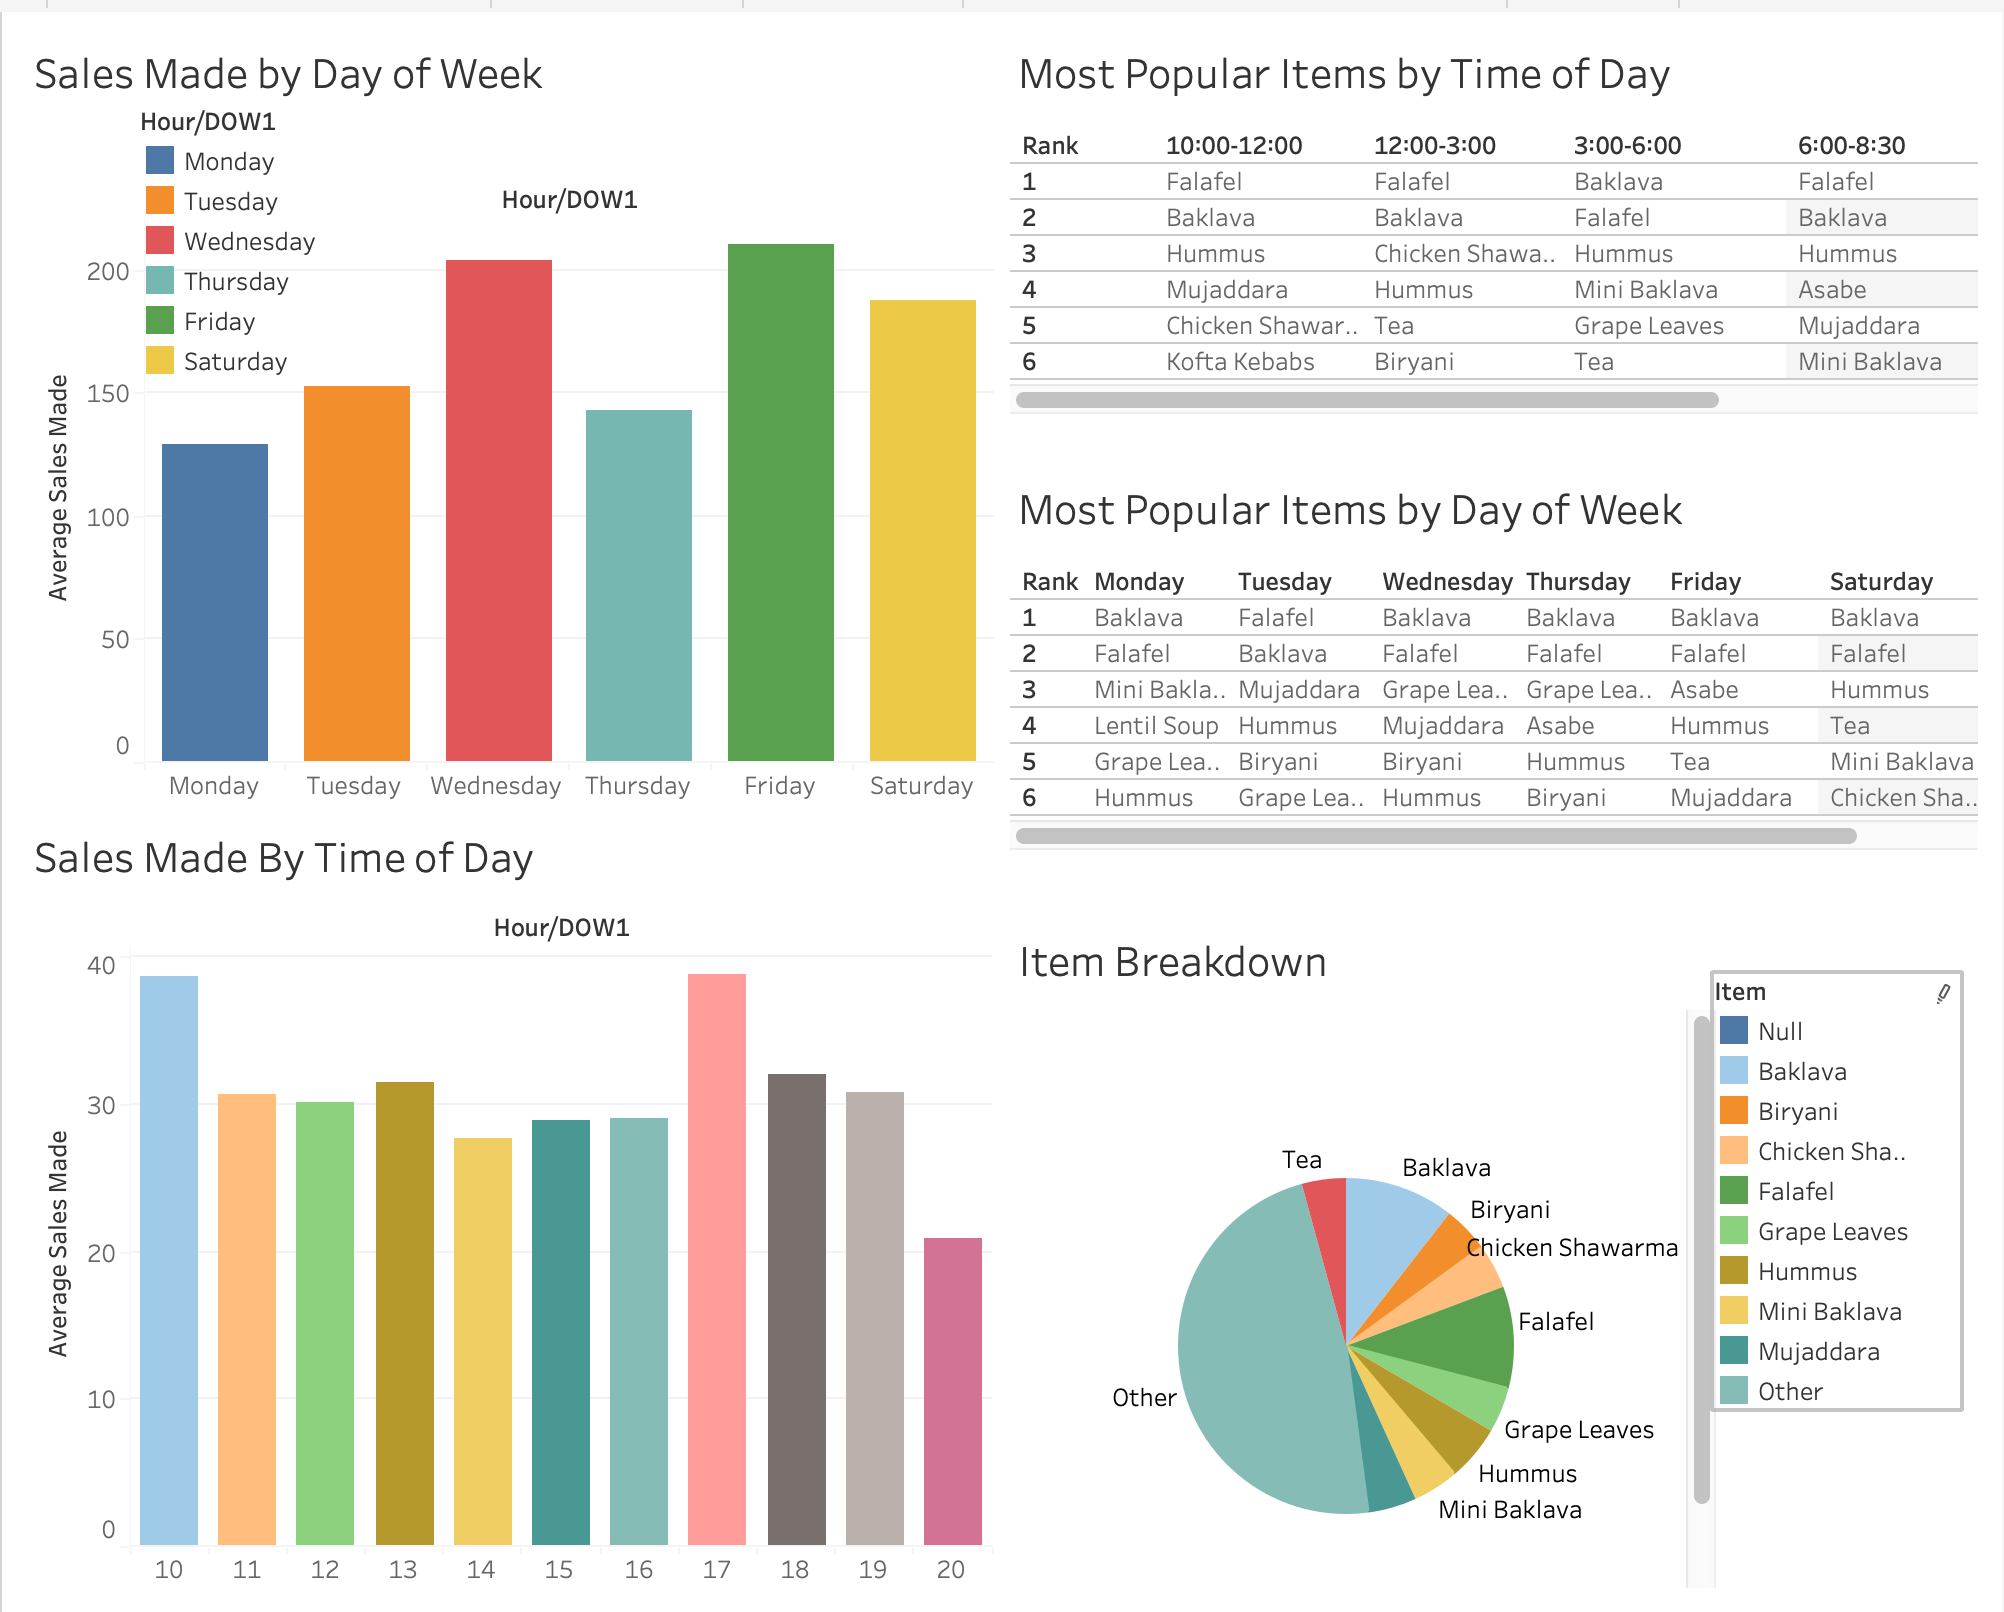
This project laid out a preliminary analysis of Havenly's sales data, while scoping out a future data solution for the company. This scoping includes an impact hypothesis, a solution path, and risks and assumptions. The data pulled for preliminary analysis was from the restaurant's shopify and squareup accounts, accounts they use for online and in person orders. I provide the results of a preliminary analysis in tableau to display what kind of basic level analysis could eventually be used to conduct more complex analysis, that can be used to increase sales.
